This post examines recurrent survey data bearing on the views of Catholics and other religious groups towards religious authority. The focus of the questions is on churches or religious organisations in general, rather than towards specific institutions. The data reported here involve analysis of the British Social Attitudes surveys (BSA; 1991 to 2018) and European Values Study (EVS; 1990 to 2017). The views of Catholics are compared with Anglicans, other Christians and those with no religious affiliation.
Figure 1 shows the proportion in each group with a ‘great deal’ or ‘quite a lot of confidence’, based on the EVS surveys. Clearly, confidence has always been much lower amongst those who do not identify with a religion, standing at 18% in 2017. The level of confidence in 2017 was very similar amongst Catholics, Anglicans and other Christians (respectively, 54%, 55% and 56%).
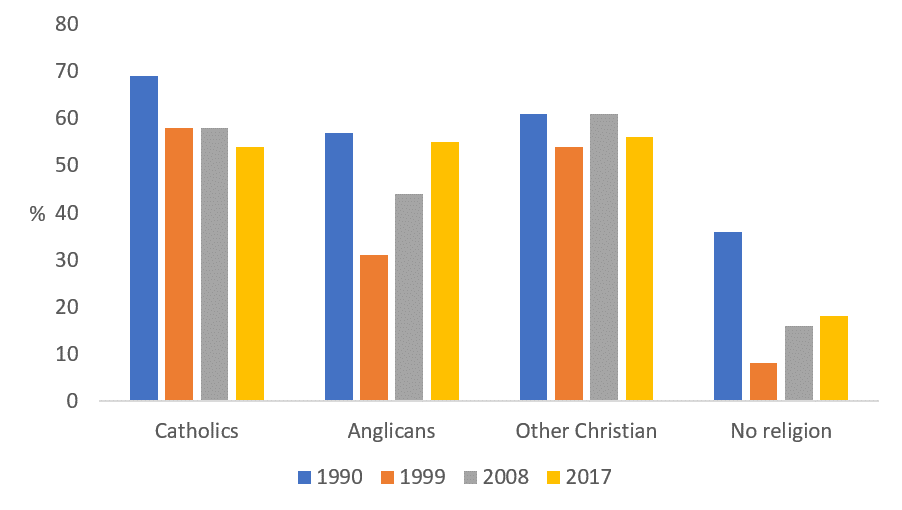
Note: Percentages combine ‘a great deal’ and ‘quite a lot’ of confidence.
Figure 2 shows levels of confidence amongst the same set of groups based on BSA surveys. The data come from the International Social Survey Programme’s religion module, which has featured in the BSA surveys of 1991, 1998, 2008 and 2018. As with the EVS data, confidence in church and religious organisations has, not surprisingly, been consistently lower within the group with no religion. In the most recent survey, 29% of those with no religion expressed some degree of confidence, while 78% of Catholics voiced confidence compared to 62% of Anglicans and 79% of other Christians.
The levels of confidence are higher in the BSA surveys compared to the EVS surveys, which may be due in part to the different response options available, in particular the ‘some confidence’ option in the former (The BSA surveys allows respondents to choose from among ‘complete confidence’, ‘a great deal of confidence’, ‘some confidence’, ‘very little’ or ‘none’. In the EVS surveys, respondents could select from ‘a great deal’, ‘quite a lot’, ‘not very much’ or ‘none at all’).
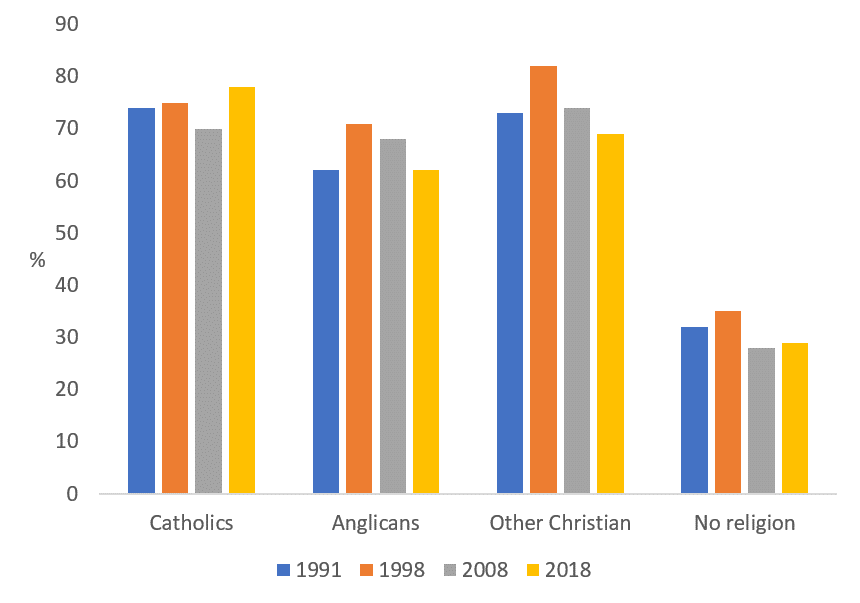
Note: Percentages combine ‘complete confidence’, ‘a great deal of confidence’ and ‘some confidence’.
Figure 3 shows the distribution of opinion to a question asking whether churches and religious organisations have too much or too little power. Over time, it is clear that the proportion saying ‘about right’ has declined across all groups and that the share of those with the view that they have ‘too much’ or ‘far too much’ power has increased. In 2018, around half of those with no religion (49%) said religious institutions had ‘too much’ or ‘far too much’ power, compared to 20% in 1991. Amongst those with a religious identification, it increased from very low levels in 1991 to around a fifth of Catholics and other Christians, and around three-in-ten Anglicans, in 2018. In each survey, very small proportions of Anglicans and those with no religious affiliation have taken the view that religious organisations have had ‘too little’ or ‘far too little’ power. The proportion with this view amongst Catholics and other Christians was initially much higher but has declined over time.
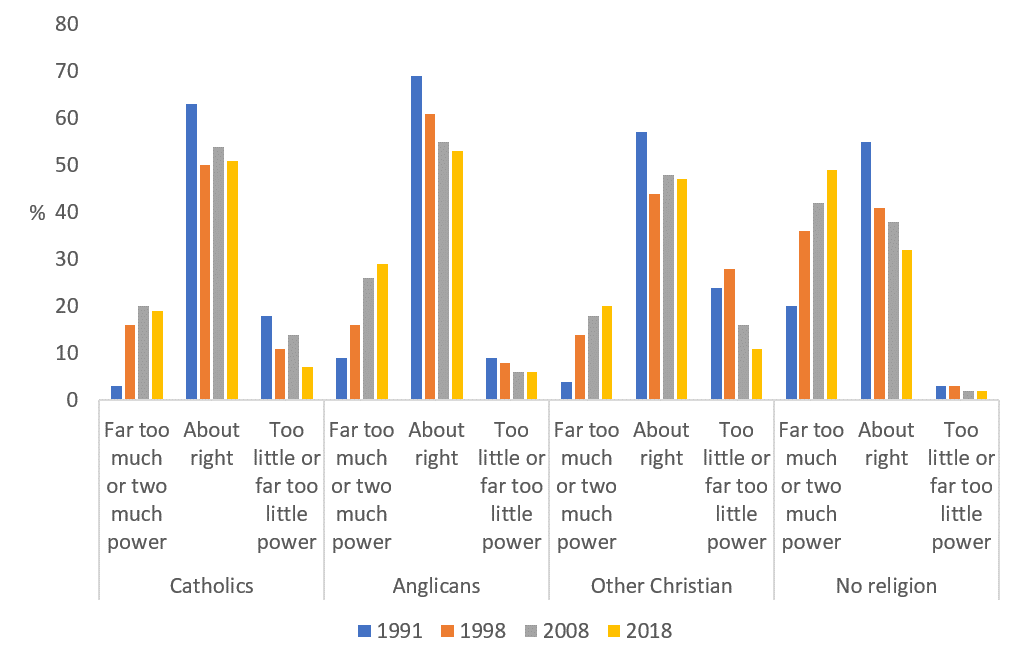
Note: Percentages for ‘can’t choose’ responses are not shown.
The BSA surveys have also asked questions about the exercise of religious authority in the political process – in relation to influencing voters and affecting government decision-making. The pattern of responses to both questions shows that, across the board, opposition to the exertion of religious authority in politics has been the most common view. Figure 4 shows agreement with the proposition that religious leaders should not try and influence how individuals vote at elections. Over time, large majorities of all groups have consistently agreed that religious leaders should not try to do this. In 2018, 82% of those with no religion were in agreement, followed by 78% of Anglicans, 77% of Catholics and 68% of other Christians. For most groups, agreement was somewhat higher in 2018 compared to 1991.
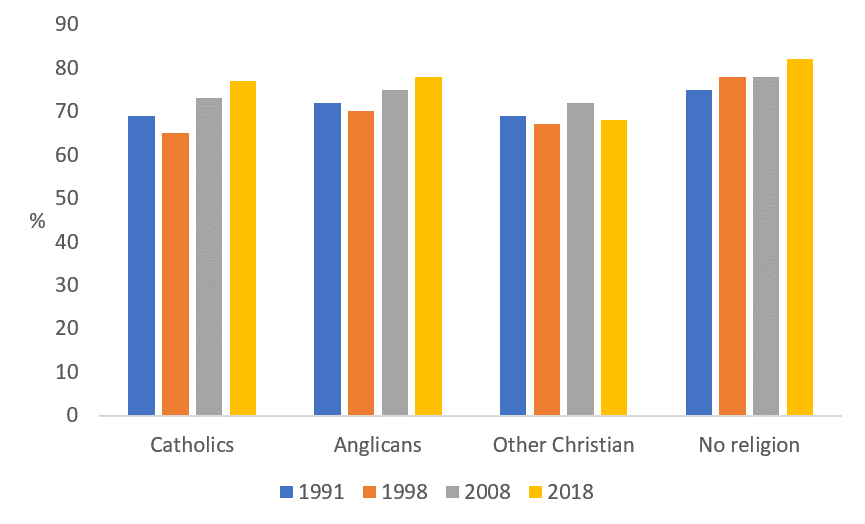
Note: Percentages combine ‘strongly agree’ and ‘agree’.
Figure 5 shows the levels of agreement with a question asking whether religious leaders should not try and influence government decisions (it was not asked in 2018). As with influencing voters, agreement has usually been the majority view across groups. That is, they been more likely to agree that it is wrong for leaders to try and influence governmental decision-making. Moreover, agreement has risen over time. For Catholics, it stood at 56% in 1991 and 61% in 2008; for Anglicans, 57% and 68%; for other Christians, 47% and 58%; whilst, for those with no religion, it increased from 63% to 75%.
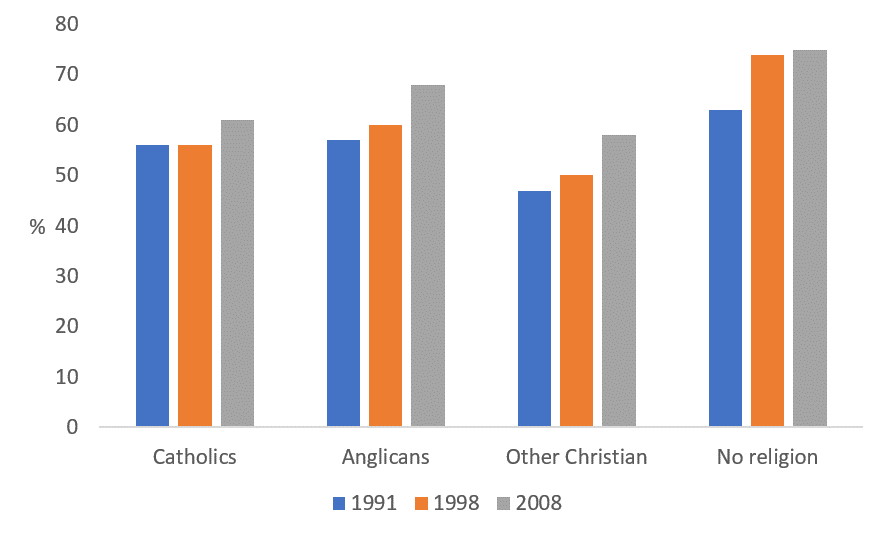
Note: Percentages combine ‘strongly agree’ and ‘agree’.