The data reported here involve analysis of data on religious affiliation from the British Social Attitudes surveys (BSA) and British Election Study surveys (BES). What can the data from these surveys tell us about levels of affiliation with Catholicism and other religious traditions in Britain over recent decades? Religious affiliation in the BSA (in every survey between 1983 and 2018) and BES (every survey from 1983 to 2017) have been gauged using the following questions:
BSA: Which religion or denomination do you consider yourself as belonging to?
BES: Do you regard yourself as belonging to any particular religion?
For clarity and consistency of presentation, the full set of response options in the surveys have been combined into five categories: Anglican; Catholic; other Christian; other religion; and no religion.
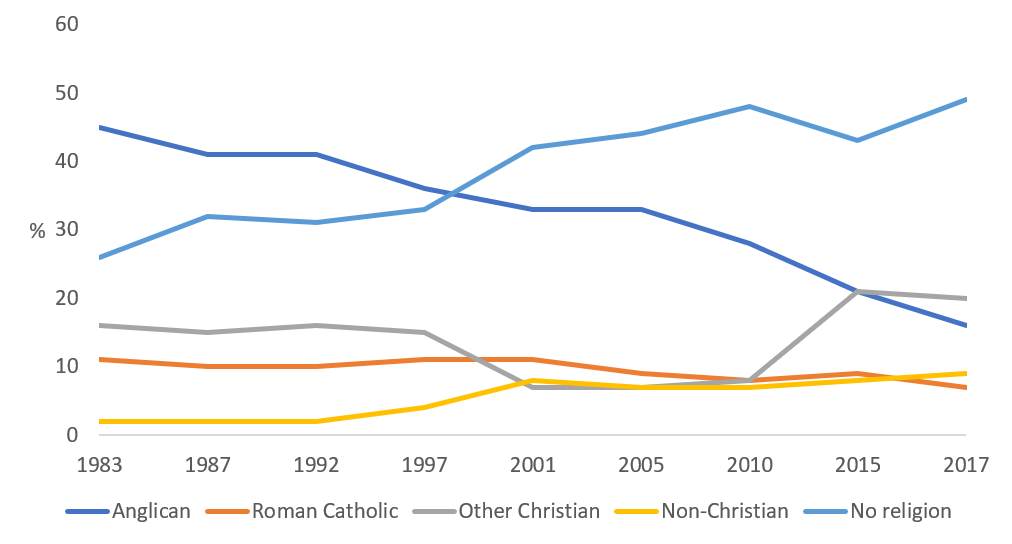
Figure 1 shows religious affiliation from 1983 to 2018, based on data from the annual BSA surveys. Key features include, firstly, the decline in the proportion identifying as Church of England (40% in 1983, declining declined to 13% in 2018). Secondly, increased identification with non-Christian faiths over recent decades (3% in 1983, 10% in 2018). Third, some decline in the level of Catholic affiliation (10% in 1983 and 8% in 2018). Fourth, the substantial increase over time in the proportion with no religious affiliation (32% in 1983 and 53% in 2018). The proportion of other Christians has risen over recent decades, from 15% in 1983 to 18% in 2018. It should be borne in mind that the composition of this group has altered, as the share identifying as non-denominational Christian has risen, with a decreasing share affiliating with a specific denomination.
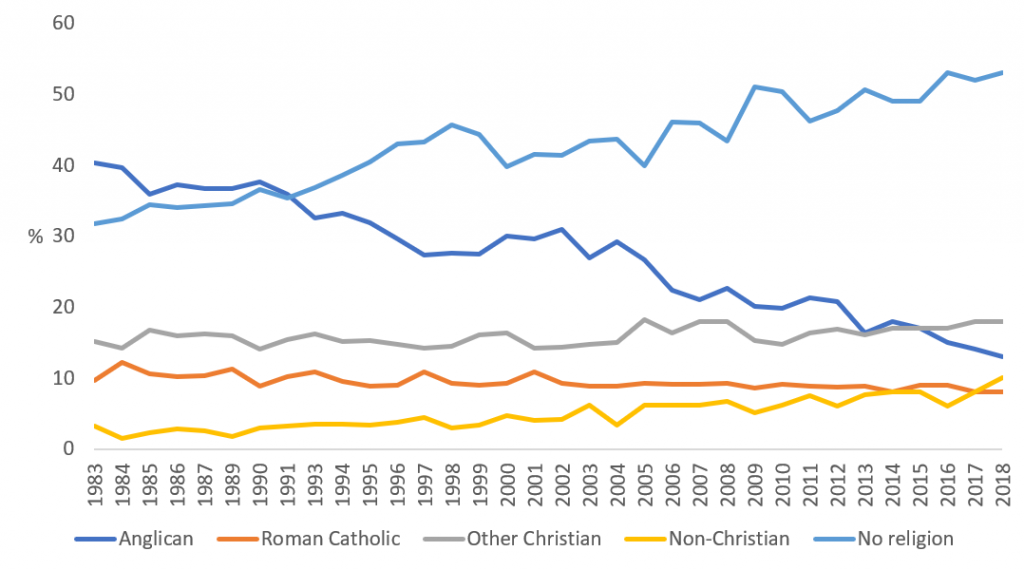
The long-term trends charted in Figure 2, based on the BES surveys, show a broadly similar pattern to that evident in Figure 1. The long-run decline in Anglican identification (from 45% in 1983 to 16% in 2017) is shown alongside the clear increase in not identifying with any religious tradition (rising from around quarter in 1983 to about half in 2017). There is some decline in identification with the Catholic faith over time, increased affiliation with non-Christian traditions and a rise in the proportion professing some other Christian affiliation.
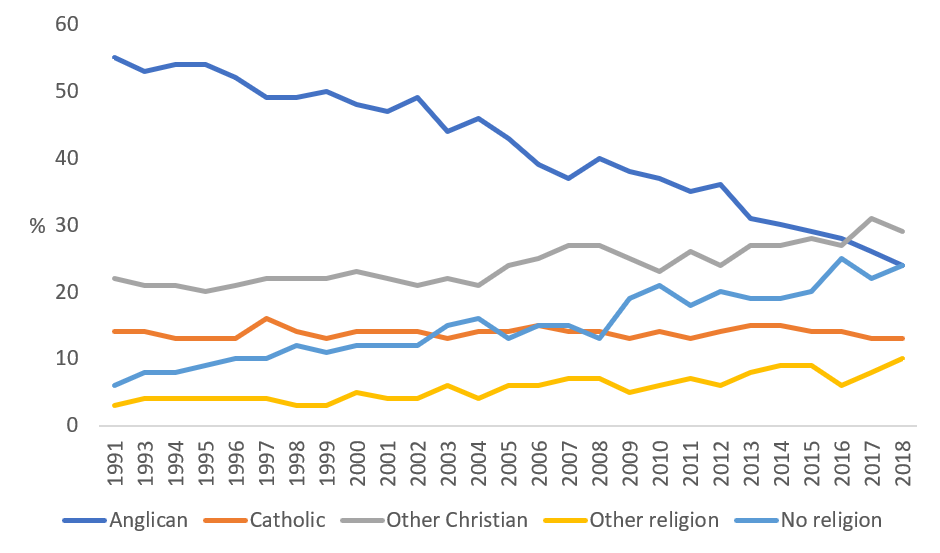
The BSA surveys, since 1991, have featured a question asking which religion individuals were brought up in:
In what religion, if any, were you brought up?
Using the same set of categories used above, the data are charted in Figure 3. In 2018, 24% of respondents said they had been raised as Anglican, 13% as Roman Catholic, 29% were raised in some other Christian tradition, with 10% brought up in some other religious faith. Nearly a quarter said they were not raised within any religious faith (24%). When the question was first asked, the proportions were rather different: over half (57%) reported being raised as Anglican, 14% as Roman Catholic, over a fifth within some other Christian tradition (22%), and 3% within a non-Christian faith. Just 6% said they were not brought up within a religious faith, when asked in 1991. The proportion saying they were raised as Anglican has seen considerable decline over the period while the share raised in a Catholic family setting has been broadly stable.