Regular churchgoing is a core part of communal religious practice in the Catholic Church. We have already reviewed trends in Catholic attendance in Britain, based on data from long-running social surveys, which showed a decline in regular attendance. Our new survey of Catholic adults in Britain allows us to analyse contemporary patterns of churchgoing amongst Catholics in Britain.
The survey was administered online by Savanta ComRes in late October and November 2019 to a nationally representative (in terms of age, sex and region) sample of British Catholics (aged 18 and over). Catholics were identified by use of a standard screening question: ‘Do you regard yourself as belonging to any particular religion? If yes, which?’
We asked survey respondents about their attendance at Mass using the following question: ‘Apart from such special occasions as weddings, funerals and baptisms, how often do you generally attend Catholic Mass?’ This wording adheres to that used in long-running surveys, such as the British Social Attitudes.
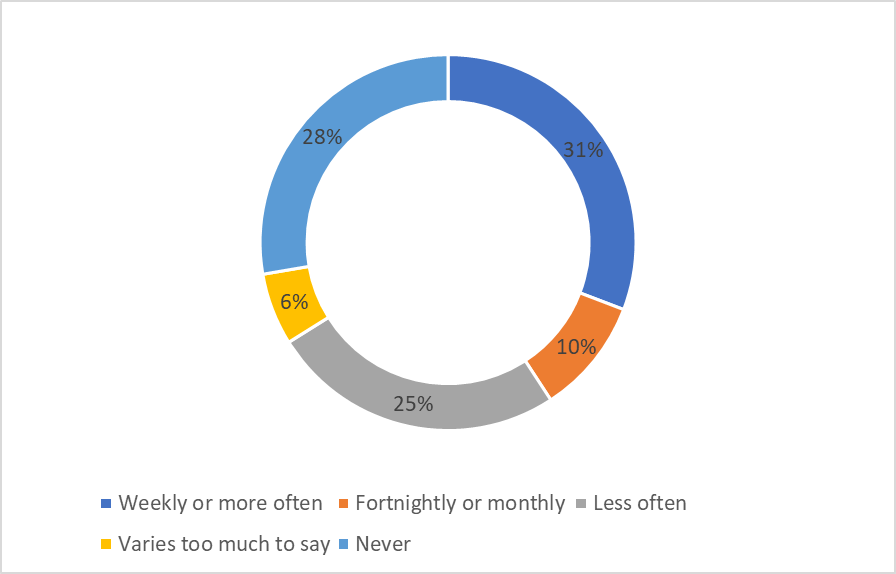
Figure 1 shows the overall percentage breakdown for Mass attendance (excluding the very small proportion that did not know). Around three-in-ten Catholics reported attending Mass on (at least) a weekly basis (31%). Within this group, 25% attended every week, with 3% apiece attending 3-4 times a week or on a daily basis. Another 10% attended fortnightly or every month. A quarter (25%) reported attending less often – every two to three months or just once or twice a year – while 6% said that, for them, it varied too much to say. The remainder, 28%, said they never attended Mass beyond going for special occasions. Amongst Catholics in Britain, then, the proportion who said they attended weekly is only slightly higher than the share that never attended.
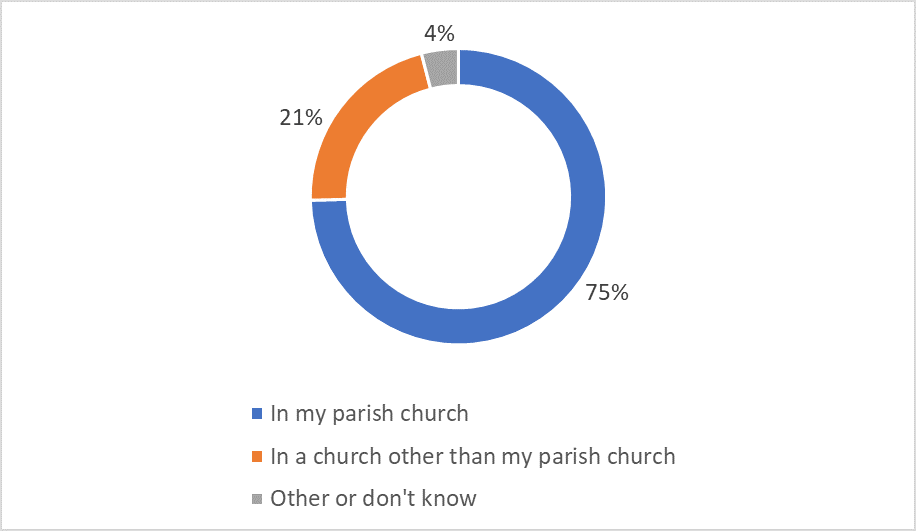
As a follow-up, we asked Catholics where they most frequently attended Mass. The breakdown of responses is shown in Figure 2. Clearly, the large majority (74%) reported that they went to their local parish church, but 21% went most often to a church that was not their local place of worship.
Previous analysis of attendance at religious services in the general British population has shown that not attending was higher amongst men and younger people, as well amongst Anglicans compared to Catholics, other Christians and those belonging to other faiths. It also differed based on educational attainment. In our survey, how did weekly attendance vary across different groups within the Catholic population?
We focus here on comparing the proportion of weekly Mass-goers within groups. Figure 3 shows the rates of (at least) weekly attendance within socio-demographic groups. There is no difference in rates of attending weekly amongst women and men (31%), Based on educational attainment (the highest qualification held), we can see that, compared to those with other qualifications, those with a degree and, in particular, advanced degrees were more likely to say they attended on a weekly basis. There was not much difference between Catholics (33%) living in Scotland or England and Wales (31%).
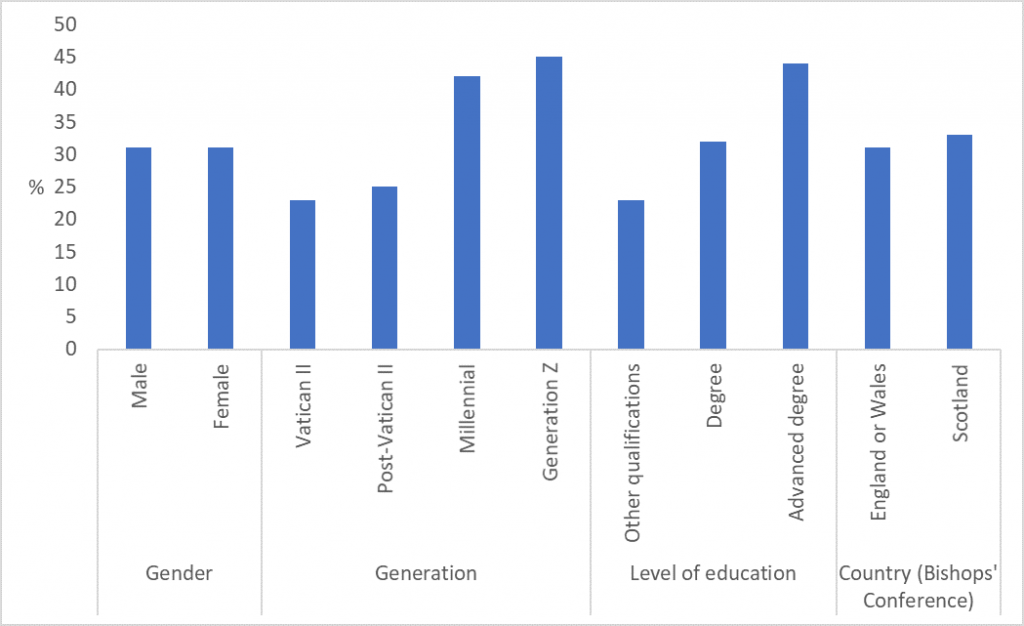
Do rates of weekly attendance differ based on generational group? To split the sample into generations, we used an updated version of a classification scheme developed by D’Antonio et al., who have studied the experiences and views of the Catholics in the US across recent decades. This produces a five-fold classification: Pre-Vatican: aged 79 and over (born up to 1940); Vatican II: aged 59-78 (1941-1960); Post-Vatican II: aged 40-58 (1961-1979); Millennial: aged 23-39 (1980-1996); Generation Z: aged 18 to 22 (born from 1997 onwards). As the Pre-Vatican group constituted a very small proportion of the sample, it is not included here.
Figure 3 shows that there was considerable variation in weekly attendance based on generational group, with higher weekly attendance amongst Catholics who are Millennials or in Generation Z (in both cases, over two-fifths reported going this often). In the two older generational groups, weekly attendance was much lower, at around a quarter of each group. Interestingly, this pattern is contrary to the association between regular religious attendance and age group seen in the general population.
Figure 4 shows weekly attendance amongst Catholics based on different aspects of their faith – how personally important the Church is, experience of Catholic schooling, and whether they were raised as Catholic from birth or converted at some stage. Amongst the group who said the Church was the most important part or among the most important parts of their life, 72% reported attending Mass weekly. This declined to 31% of those for whom the Church was quite important to them and stood at just 5% of those who said the Church was among the least important parts or not an important part of their life.
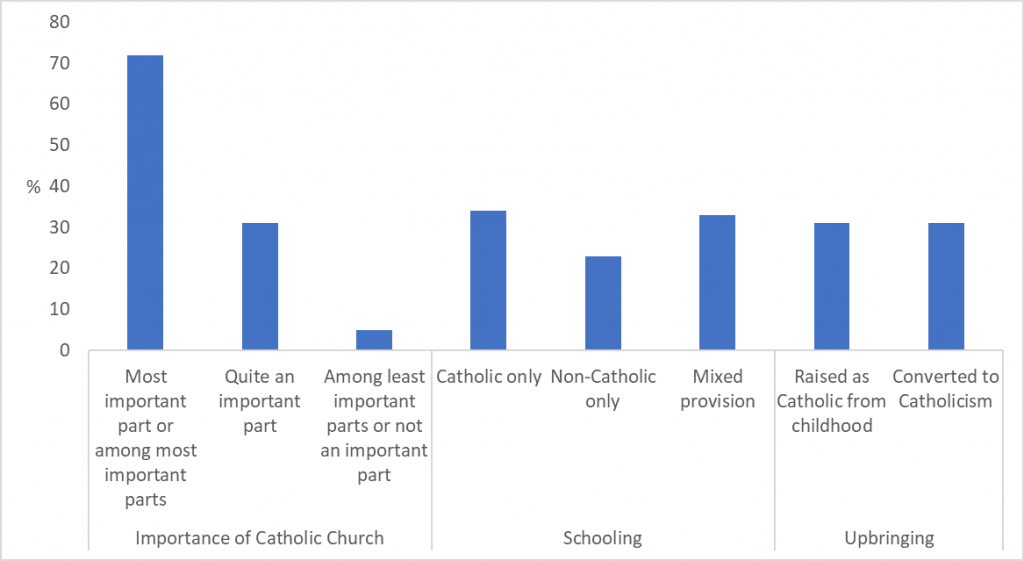
There was no difference in weekly attendance between those who were raised as Catholic from birth and those who converted (33%). Based on schooling, we can see that the proportion attending weekly was 23% amongst those who had no Catholic schooling, compared to 34% of those who only attended Catholic Schools (at primary and secondary levels) and 33% of those with mixed provision (having attended both Catholics and non-Catholic schools).